
Evaluation of LLDPE
| Evaluation of LLDPE | The same product, but from different manufacturing batch behaved different in the processing. The purpose is to find out if the rheometer can tell the difference. |
|---|---|
| Instrument | Twin capillary rheometer |
| Temperature | 230℃ |
| Die | Long die = diameter 1mm,length 16mm,180゜ Short die= diameter 1mm,length 0.25mm,180゜ |
| Piston speed | We slowed down shear rate from 1500/sec to 6/sec in 8 steps, first, then raise it back in 7 steps. We tried to check the reproducibility of the results. |
■The result and sicussion
The【Figure12】is the shear viscosity data plotted against the shear rate.
The differences of the shear viscosity among A, B,C seems to be small.
Quick look may tell, A is easier to process since it has a lower shear viscosity.

The【Figure13】is elongational viscosity plotted against shear rate.
It shows huge elongational viscosity difference in the low shear rate range.
And Batch A seems to have the biggest resistance against the material stretching.

The【Figure14】is the one of elongational viscosity against elongational stress.
When you plot against the elongational stress, the difficulty of Batch A is clearer. It accepts the very small range of elongational stress, and it changes the viscosity rapidly with the small stress change. Thus, we can tell Batch A would be very difficult to use for certain manufacturing process.

Evaluation of ETFE
| Evaluation of ETFE | The same product, but from different manufacturing batch behaved different in the processing. The purpose is to find out if the rheometer can tell the difference. |
|---|---|
| Instrument | Twin capillary rheometer |
| Temperature | 297℃ |
| Die | Long die = diameter 1mm,length 16mm,180゜ Short die= diameter 1mm,length 0.25mm,180゜ |
| Piston speed | We slowed down shear rate from 15000/sec to 10/sec in 8 steps, first, then raise it back in 7 steps. We tried to check the reproducibility of the results. |
The result and sicussion;
The sample is ETFE from the same product, but from different manufacturing batches. When they extrude batch A, the product shows a shark skin on the surface. The batch B, C and D did not show any problem.
【Figure15】is the graph of shear viscosity plotted against shear rate. As we can see, the material manufacturer does a quite good quality control and the shear viscosity is the same in the measured shear rate range.
What is important is, we measure the same shear rate 2 times. So, the thermal stability is also quite good on these materials.
However, when we compare the elongational viscosity【Figure16】【Figure17】, there is a huge difference in low shear arte or elongational stress area. And Batch A is very high.
So, it would be easy to identify the problematic batch by measuring elongational viscosity.
We have the same kind of results with PC and Rubber.
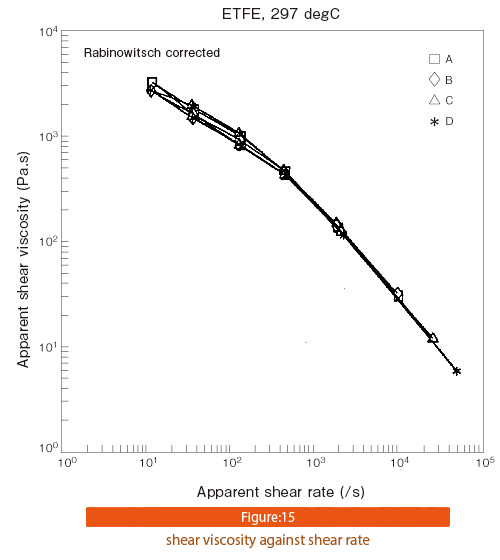
Figure15
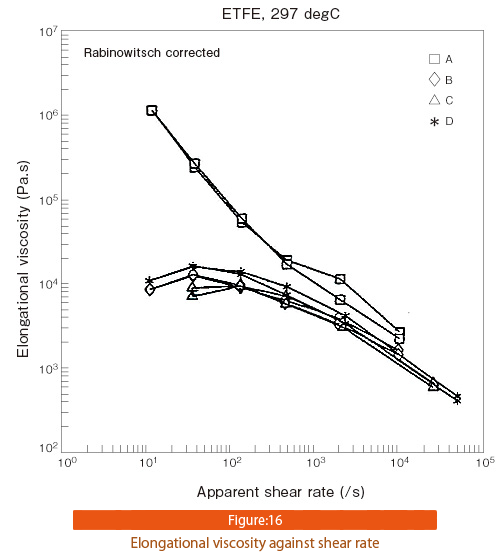
Figure16
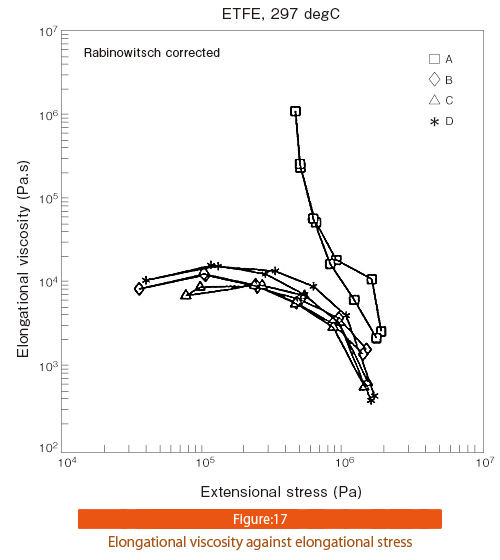
Figure17
Evaluation of ABS
| Evaluation of ABS | The purpose is to find out if heating up the extruder or cylinder is the right choice with ABS. In otherwords, temperature dependency is measured. |
|---|---|
| Instrument | Twin capillary rheometer |
| Temperature | 200℃・230℃・260℃ |
| Die | Long die = diameter 1mm,length 16mm,180゜ Short die= diameter 1mm,length 0.25mm,180゜ |
| Piston speed | We slowed down shear rate from 3000/sec to 30/sec in 5 steps, first, then raise it back in 4 steps. We tried to check the reproducibility of the results. |
■The results and discussion
The【Figure18】is the curve of shear viscosity, plotted against shear rate.
Higher temperature shows lower viscosity. So, this is very reasonable.

The【Figure19】is the graph of elongational viscosity
200℃ shows higher elongational viscosity in low shear rate range. Higher elongational viscosity means, the material shows more resistance against stretching. And stretching can happen in any converging/diverging flow.
